
Here are some highlights from Charles Murray’s new book:
* From the first census in 1790 through the 1850 census, the population within America’s settled regions was 82–84 percent European and the rest was African. Subsequent tides of immigration increased the proportion of Europeans. As of the 1960 census, America was about 87 percent European, 11 percent African, something more than 1 percent Latin, and something less than 1 percent Asian.
* America’s big cities have been transformed by immigration over the past several decades. In 1960, New York was the most cosmopolitan city in America but its population was still more than three-quarters European. New York City went from 77 percent European in 1960 to 32 percent in 2019. That’s a transformation by any definition.
Other major cities changed even more than New York did. From 1960 to 2019, Los Angeles went from 85 percent European to 29 percent; Chicago went from 82 to 34 percent; Houston went from 77 to 23 percent. All the rhetoric about the racial diversity of America is true – for big cities.
I am defining big-city America as urban areas with populations of 500,000 or more in a contiguous urban environment (which often does not correspond to the legal boundaries of the city). There are fifty-two of them, all located in the Lower Forty-Eight. The fifty-two urban areas take up only 1 percent of the Lower Forty-Eight’s land mass, but they contain 70 percent of its Asians, 54 percent of its Latins, and 52 percent of its Africans. No race has a majority of big-city America’s population. Europeans amount to 45 percent, followed by Latins at 25 percent, Africans at 17 percent, and Asians of all varieties at 9 percent.
The total population of big-city America is 127 million, representing 39 percent of the total population of the Lower Forty-Eight. That’s a lot, but it also means that a majority of Americans live in rural areas, towns, or cities with urban populations of fewer than 500,000. They live in the other 99 percent of the Lower Forty-Eight’s land area.
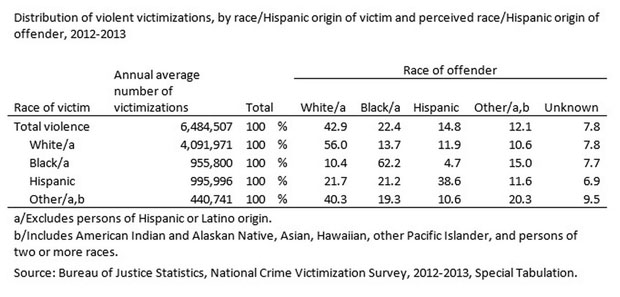
* For homicides nationwide from 2010 through 2019, 76 percent of alleged perpetrators knew the victim, as a family member or an acquaintance. Virtually all of those homicides were what criminologists call “expressive” murders: the result of arguments, brawls, jealousy, and other interpersonal conflicts. An extremely high proportion of the alleged perpetrators of these crimes were in fact guilty – expressive murders are usually impulsive and occur without precautions against getting caught; they are often witnessed; and the forensic evidence is often abundant.
* Now let’s look at the 24 percent of homicides in which the victim was a stranger to the arrested suspect. About 13 percent of all murders are gang-related.
* Africans and Latins are arrested for property crimes at higher rates than Europeans – modestly so for Latins, with a mean ratio of 1.5, and much more so for Africans, with a mean ratio of 5.0. These ratios are smaller than the ones for violent crime.
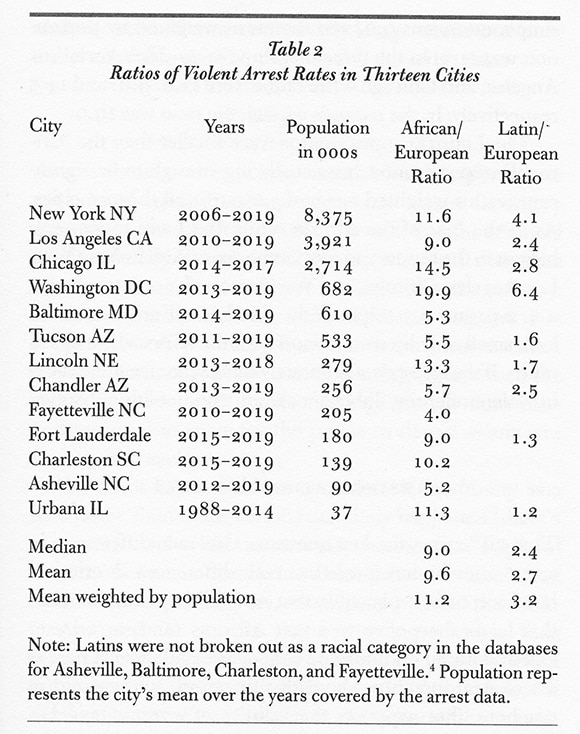
Across thirteen American cities, including four of the nation’s most important ones, the African arrest rate for violent crime was usually around 9 to 11 times the European rate and the Latin arrest rate for violent crime was usually around 2 to 3 times the European rate. Asian arrest rates for violent crime ranged from minuscule to small. These are huge differences. Triangulating data indicates that the arrest rates reflect, and perhaps understate, race differences in violent criminal activity.
* Universities do their best to hide what’s going on. They refuse to reveal mean SAT scores by race, proclaiming that “everyone we admit can do the work.” What they don’t acknowledge is that the admitted African and Latin students, as groups, will be concentrated in the bottom of their classes – and that the people making the admissions decisions know it in advance.
Occasionally, sunlight penetrates the darkness. The biggest leak occurred in late February 1993, when Richard Herrnstein, a professor at Harvard and my coauthor on The Bell Curve , arrived at his office one morning to find that someone had anonymously left a copy of the “Red Book” on his desk. At that time, the Red Book was produced annually by the Consortium on Financing Higher Education, which consisted of 16 out of the top 20 universities and 5 of the top 10 small colleges as ranked by US News for 1993. It was the university equivalent of leaking a Top Secret CIA document. The Red Book contained the mean SAT scores by race for each of the schools.
The median edge given to African applicants at those elite schools was about 180 points on the combined SAT, equivalent to approximately 1.3 standard deviations at the time – a larger gap than separated Africans and Europeans in the general population. Someone with an SAT score 1.3 standard deviations below the mean is at the 10th percentile of the distribution at those colleges. We published the school-by-school information in The Bell Curve .
Nothing seems to have changed since then. We don’t have a current version of the Red Book to work with, but testimony in the recent case charging Harvard with discrimination against Asian applicants included evidence that the same profile of test scores, GPA, and extracurricular activities that gave an Asian applicant a 25 percent chance of admission gave an African applicant a 95 percent chance and a Latin a 77 percent chance.
* The numbers of test takers with a combined verbal and math score of 1500+ were around 900 for Africans and around 3,300 for Latins. Meanwhile, the numbers for Europeans and Asians with scores in that range were about 27,500 and 20,000 respectively.
* In terms of percentiles, Africans are in the bottom quartile of test scores for all the admissions tests except for those heading to business school or graduate school in education. The Latin scores are all in the second quartile.
* I turn now to an issue that involves only a tiny proportion of the workforce but has high visibility: the rarity of Africans and Latins in the most prestigious jobs in the private sector. That rarity is often used as undeniable evidence of systemic racism in the job market.
Many of those high-prestige jobs are filled by people not merely in the top few percentiles of cognitive ability, but well into the top percentile. Recall the discussion of the “width” of the top percentile of a bell curve in Chapter 3 – LeBron James is in the same percentile as starting players on ordinary college teams. The same phenomenon applies to an oncologist in an ordinary practice and the chief of oncology at a major research hospital. The former may be an excellent oncologist, but the latter has undergone a severe winnowing process that among other things has selected specifically for evidence of intellectual brilliance. Other examples of positions that select for extremely high cognitive ability are:
* A full professorship at an elite university
* A senior position in the financial industry
* A senior position in the IT industry
* Law partner in a major firm in a major city
* CEO of a major corporation
This is not to say that intellectually brilliant people typically have important jobs in a society – on the contrary, few do – but that a characteristic of people who rise to the top in every cognitively demanding profession in elite academia and elite organizations in the private sector is exceptionally high cognitive ability. I will operationalize exceptionally high as a minimum IQ of 135. High-prestige jobs in government and the nonprofit sector are also sometimes filled by exceptionally able people, but the rigor of the screening process varies a lot by job and organization.
* Employers seeking these exceptionally intelligent young adults [25-29yo, IQ above 135] were choosing from a pool that contained only about 2,800 Africans and 9,500 Latins compared to 50,700 Asians and 160,100 Europeans.
* a large majority of U.S. employers that seek out new hires with 135 + IQs had no entry-level Africans or Latins among those hires. Zero, no matter how eagerly the employers solicited minority candidates. There weren’t enough to meet the demand.
* Let’s say that an elite IT company in Silicon Valley snags 100 new hires from the 135+ pool in the racial proportions of the pool as a whole. That means 70 are European, 22 are Asian, 4 are Latin, 1 is African, and 3 are a mixture of races or “other.” What percent of new hires of any race in any company rise to senior positions? It depends on the organization, and the definition of senior, but in any case the four Latins are competing against 96 others and the one African is competing against 99 others to become one of the chosen few. Those are daunting odds.
* The 2014–2018 American Community Survey found that Africans, at 13 percent of the population, accounted for only 3.6 percent of CEOs, 3.7 percent of physical scientists, 4.4 percent of civil engineers, 5.1 percent of physicians, and 5.2 percent of lawyers. Latin percentages in those prestigious occupations ranged from 5.3 to 7.6 percent, but Latins are almost 18 percent of the population, so their underrepresentation was nearly the same.
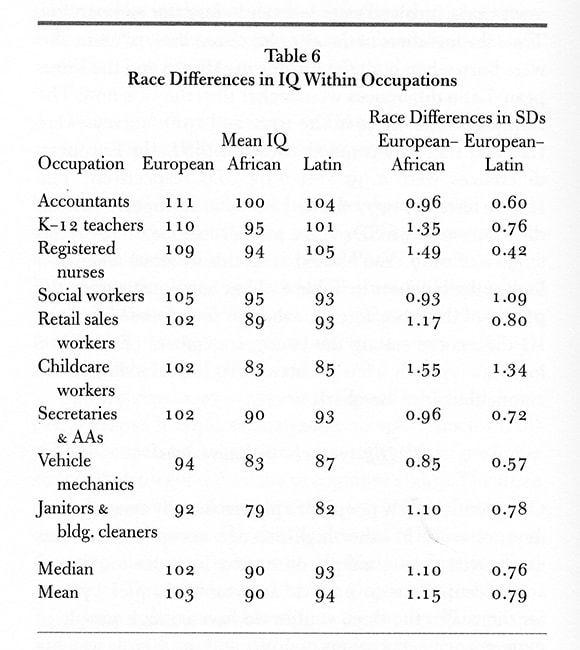
The picture flips when race differences in cognitive ability and job performance are taken into account. Africans and Latins get through the educational pipeline with preferential treatment in admissions to colleges and to professional programs. Their mean IQs in occupations across the range from unskilled to those requiring advanced degrees are substantially lower than the mean IQs for Europeans in the same occupations. Race differences in measures of on-the-job performance are commensurate with the differences in cognitive ability.
I think it is fair to conclude that the American job market is indeed racially biased. A detached observer might even call it systemic racism. The American job market systemically discriminates in favor of racial minorities other than Asians.
* In big-city America, disproportionate minority crime rates cause Europeans and Asians to avoid going into minority neighborhoods. Crime rates and socioeconomic status both vary widely across zip codes in minority neighborhoods in big-city America. These areas contain middle-class zip codes and impoverished ones; zip codes with low crime rates and others with high crime rates. But that makes no difference to the perception held by most Europeans and Asians. Unfamiliar with these variations, they typically see the entire minority part of town as potentially dangerous. It’s not a matter of simple racism. The same Europeans and Asians who avoid going to the minority part of town may have minority colleagues at work with whom they get along fine. They may have minority neighbors with whom they are friends. But they won’t go to the minority part of town to shop, stay at a hotel, buy a car, or send their children to school. They don’t drive into it unless it is the shortest route to someplace they need to go.
* Widespread and voluntary residential segregation by race seems to be a fact of life around the world, no matter what the races are or what the country’s economic and political system is.
* In big-city America, disproportionate minority crime rates deter developers from building office space in minority neighborhoods unless gentrification is already well underway . Real estate is typically cheaper in African or Latin parts of town than elsewhere, a factor that would ordinarily attract developers to build office space for law firms, doctors’ offices, and other businesses that would like to escape the high rentals in the European midtown. But unless it is clear that the neighborhood is near a gentrification tipping point, those lucrative rentals won’t happen, and so the office buildings don’t get built.
In big-city America, disproportionate minority crime rates raise the costs of doing business for retailers of all kinds . It is often alleged that large commercial chains avoid putting stores in minority neighborhoods. The empirical part of the allegation is sometimes true, but the inference that racism is to blame does not follow. Shoplifting is far more common in many big-city minority neighborhoods than elsewhere. It often doesn’t make economic sense for big chain stores, which have business models based on low profit margins, to locate in such neighborhoods. Either they won’t make a profit or they will have to charge higher prices, leaving themselves open to accusations of racist price gouging. If they take measures to apprehend shoplifters, they risk charges of racism and financial shakedowns through the threat of lawsuits. Actions taken to prevent shoplifting can also put employees at risk of violent confrontations. It’s a no-win situation. Opening a store in a big-city minority neighborhood is often not economically rational. Racism need not have anything to do with the decision.
Meanwhile, the small locally owned retailers in a big city minority neighborhood also have a hard time making a profit because of shoplifting, the threat of robbery, high insurance costs, and banks’ reluctance to make high-risk loans. The locally owned stores tend to be poorly stocked, with few amenities, and overpriced relative to stores selling the same goods elsewhere.
* For every situation that a cop faces, let us say there is an optimal choice, as defined in the police training manuals or perhaps by an omniscient observer. As the environment in which police are working becomes more dangerous, that optimal choice moves along the distribution toward the use-more-force-and-defensive-precautions tail of the bell curve.
One result is that well-trained police exercising good judgment will, on average, take more steps to establish their authority, call for more backup, and respond with more force to provocations in high-crime parts of town than in low-crime areas, regardless of the race of the citizens they are dealing with.
Another result is that errors in judgment will be skewed toward the greater-force end of the distribution. If the error in the direction of greater force is perceived as reducing the downside risk, and the downside risk is one’s own death, then police officers, being human, will err on the side of protecting themselves. Added to that human reaction is the mental stress associated with combat – stress unlike anything that most of us (including me) have ever experienced. The physiological effects of the adrenaline surge are powerful, and they are in addition to the psychological effects of fear and anger. All of these factors mean that police use of force, including excessive use of force, will always and inevitably be higher in high-crime areas than in low-crime areas, and high-crime areas in the United States are overwhelmingly urban and African or Latin.
* James Q. Wilson wrote: A central problem – perhaps the central problem – in improving the relationship between white and black Americans is the difference in racial crime rates. No matter how innocent or guilty a stranger may be, he carries with him in public the burdens or benefits of his group identity….
… When whites walk down the street, they are more nervous when they encounter a black man than when they encounter a white one. When blacks walk down the street, they are more likely than whites to be stopped and questioned by a police officer. It is important, of course, for whites to know that a chance encounter with a black creates little risk and for police officers to know that they should have more criteria than just skin color to decide who is worth questioning. Many whites and many police officers know this, but in spite of what people know, the racial tension persists. Countless white pedestrians have been worried by the sight of a young black male, and countless innocent black men have had their cars stopped or their walk interrupted by a suspicious cop. White pedestrians may be embarrassed by their own caution; certainly black pedestrians are upset by unwarranted police intrusions….
… Whites are fearful of living amid large numbers of blacks and of sending their children to predominately black schools. Blacks interpret the way they are treated on the streets by white strangers and by police officers as a sign that they can never make much social progress. “No matter what I do, I can never be regarded as innocent,” many embittered black men will say. “I cannot hail a cab as easily as a white, and I will be stopped and questioned by the police more than any white. Integration is a joke.”
Joe* says:
Murray’s figures about the changes in racial composition of the cities, contradicts, at least on the municipal level, the assertion that there is no replacement of whites.
One of the things implied by Murray, but not directly expressed is how lower cognitive ability makes it more difficult to comply with regulations. Sometimes licensing requirements really bear little or no relationship to the occupations licensed. The classic example is cosmetic work (hair dressing, nails among unlicensed blacks) where the effect of the licensing requirements does discriminate against those with below average intelligence. But one of the reason minority professionals have problems is because they often lose track of the recordkeeping requirements. I don’t think that blacks are more larcenous than whites, but I think they are often times not aware if they are businessmen of the requirement to pay employee’s taxes.
Murray gives a chart which shows that the mean IQ among black teachers is 95. No wonder there is so much objection to proficiency tests. My belief is that many civil service jobs suffer from affirmative action, because the jobs can be better performed and more efficiently by a smarter person. Of course if IQ tests and merit based employment governed who would get civil service jobs and teaching jobs, you would wipe out the black middle class. That is the price we have to pay to maintain some modicum of economic stability.