
A group of blogs and Internet forums, led by blogger Steve Sailer, have come together to embrace a successor to the pseudoscientific racist movements of the 20th century. “Human biodiversity” (HBD) is the term they have used to give their particular theories a policy-wonk zing. (Read an in-depth explanation of the human biodiversity phenomenon here.) One of the hallmarks of HBD blogs is the use of data and charts from genetics studies to “prove” their theories. This evidence is culled from articles in the leading journals of population genetics and behavioral genetics, and published by some of genetics’ leading lights. But what does this evidence look like? And, if they’re using cutting-edge research to make their points, does that mean their theories hold some water?
We’ll start with the “evidence” itself. Most often it takes the form of what’s called a principal component analysis. A PCA is able to boil down a data set comprising hundreds or even thousands of dimensions (think the largest spreadsheet you’ve ever seen) into a 2D plot. (Or, depending on the type of analysis you’re running, 3D, or 4D, and so on.) If you do a PCA of a bunch of distinct genomes from around the world, you’ll get something that looks like this:
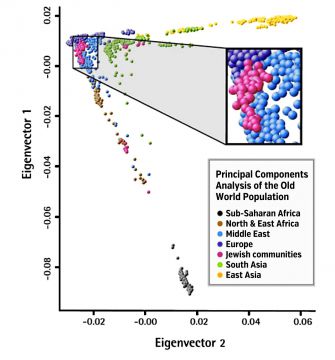
This PCA chart is from an article called “The population genetics of the Jewish people,” by Dr. Harry Ostrer and Dr. Karl Skorecki. Each individual dot represents one genome — one person’s DNA. The chart is just one of several data analysis methods they use for showing the genetic “location” of Jews — somewhere between Middle Eastern and European, as it turns out. The chart also shows, quite clearly, that all three of those populations are rather far away from the cluster of sub-Saharan African genomes.
This doesn’t, however, mean that sub-Saharan Africans are a different “race” from Jews. The chart is scaled so that differences between groups are enhanced: even though the two groups are far away from one another on the chart, the “distance” represents a very small amount of genetic variance. (And, if this chart included “New World” genomes, you would see much of the empty space taken up with a continuum of African American, Native American, Latino and Caribbean genomes.) Another kind of chart, called a neighbor-joining tree, (similar to a cladogram in evolutionary biology) also shows spatially the amount of variance between the genomes of certain populations, in order to discern the ancestry and descent of the different groups.
Geneticists use charts like these — that scale up, visually, the genetic differences between human populations — because they are interested in tracing the changes and mutations that happen at the level of a single trait, like eye color, or even a single nucleotide (the “building blocks” of DNA). Though a mutation on the scale of a single nucleotide might, for example, significantly increase your risk of getting Alzheimer’s disease, it doesn’t say much about your innate capabilities or faults as a member of a certain “race.”
HBDers can cite the data all they want: it just simply doesn’t say what they want it to say.
COMMENTS (from the heavily censored Forward.com):
* I realize articles like this are just to keep the troops in line–no progressive Jews should read about this genetics stuff and lose belief in the narrative!
But it’s just weird\depressing how folks–certainly intelligent–can stare something in the face and then just spew out nonsense.
This doesn’t, however, mean that sub-Saharan Africans are a different “race” from Jews.
This, of course, is exactly what the graph shows–it shows genetic distance and clumping. The interesting thing is that the clumping between sub-Saharan Africans and Jews (or Europeans or Chinese) is *complete*. There is no overlap. If that isn’t “race” … then the word has no meaning. (It’s essentially disproof of the “race is only skin deep” notion.)
Then this:
Geneticists use charts like these — that scale up, visually, the genetic differences between human populations — because they are interested in tracing the changes and mutations that happen at the level of a single trait, like eye color, or even a single nucleotide (the “building blocks” of DNA).
Well no. The chart is about massive numbers of genes, and hence ancestry and race. It in fact says almost nothing interesting about individuals genes. Something like say an allele to allow adult lactose tolerance could develop somewhere else and end up spreading completely through some other population that was engaged in herding with just some very minimal genetic contact and you’d still have these discrete genetic “clumps”. (Maybe we can replace race with “clump” or “cluster”.)
Then:
HBDers can cite the data all they want: it just simply doesn’t say what they want it to say.
Well sure. It’s one chart. It says nothing about what traits these various “clusters” have–says nothing about IQ, personality traits, disease resistance … anything. All that stuff one has to figure out with more data. But it does tell you that the clusters vary by large numbers of genes and are in fact “clusters” with different genetic profiles. In other words, it shows that there *could* be variation between these clusters in genes with real world impact. What those are and their effects and why they evolved are all topics of HBD discussion.
* Why post this Ari? The Jewish community is suffering from the effects of miscegination in the diaspora. You know it and I know it. We are not the same. To think Jews are on the same level as non-Jews is insulting to Jews everywhere.
* Actually, this posting gives no real exposition of the HBD, nor does it present any logic refuting any hypothesis. It’s more of the “point and sputter” category.
A Principle Components Analysis is a way to find a small number of factors to give a rational explanation to a mass of data. In other words, it’s an attempt to find an explanation. But, there are two criteria that have to be met before a PCA has any validity: it has to explain a significant amount of the differences, and it has to be replicable over different studies. Otherwise, any finding can be simply taking advantage of chance. You can also have external validity, where the derived PCA dimensions correspond with other windows on reality.
The HBD movement attributes a large amount of the group differences in behavior to genetic influence. Where the groups are clearly distinguishable, and the behaviors are clearly differentiated and persistent, the statistical analysis doesn’t have to be very sophisticated. Thus, the high rate of criminal behavior in black populations, as compared to white or Asian. The PCA provides some explanation, but is not necessary for validation.
What do group differences mean? They are not a prescription for treatment of individuals. Instead, they have implications for policy. A high rate of black incarceration does not imply a biased criminal justice system. Similarly, a low rate of black admissions in prestigious universities does not imply a biased admissions system. It simply reflects persistent group differences that are not susceptible to policies or pedagogical approaches.
A recognition of group differences actually allows better uses of resources. Methods of policing and methods of education can be geared to the individual, rather than spending resources trying to achieve equal outcomes for groups that are not, in fact, equal.
Of course, group differences does not mean that there are not injustices in a system. For instance, the police in Ferguson were said to have given out a high number of unnecessary traffic citations which had the purpose of enhancing city revenue rather than maintaining secure streets. This, however, has to be judged on its own merits, rather than a blanket determination that there was a “disproportionate impact”.
* ‘represents a very small amount of genetic variance, [which is irrelevant because it’s small]’
Then you go on to say:
‘Though a mutation on the scale of a single nucleotide might, for example, significantly increase your risk of getting Alzheimer’s disease,’
Right, so genetic variation between races is irrelevant because it’s small, and small variation in genetics can cause as profound phenotypic variations as not having and having Alzheimers.
On the side of your website, there’s an ad run by ‘the albert einstein college of medicine’ inviting visitors to your site to discover the secret of aging, which the ad implies ‘runs in the family’
You better shut that ad down because its invoking genetics to explain a phenomenon related to humans.
* I’m not sure there’s anybody in the HBD community who believes that the mere separation of different groups genetically entails a genetic difference on any particular set of traits. What the genetic separation entails is simply the POTENTIAL for a genetic difference on various traits; genetically separated groups can have occupied different environments, and have been subjected to different selection factors, and so would have a different distribution of genes relevant to a particular trait.
Whether one wishes to call these genetically separated groups “races” is a matter mostly of linguistic convenience, because the underlying facts remain the same.
Despite all his huffing and puffing, I don’t think Mr. Feldman would disagree that the average person of Sub-Saharan ancestry looks rather different from the average Jew or European. That’s a genetic difference, of course, and possible only because of the genetic separation.
The question is, are there other traits, not simply those apparent to the eye, on which, say, the person of Sub-Saharan ancestry differs on average genetically from Jews and Europeans?
Despite all the attempts to pretend that genetic differences between these groups are only skin-deep, nothing in science would distinguish traits such as IQ from skin color or facial/body shape and composition in terms of their susceptibility to differential selection. One can determine whether such genetic differences exist only by empirical investigation.
And people in HBD pay attention to such empirical investigation, unlike, it seems, Mr. Feldman.